|
Title: Mapping Caregiving
Author: Robin Ray
Working with data
Photocopying and redating ecomaps between interview rounds was a useful technique that reminded the caregiver of their network and also saved the time that would be needed to draw an ecomap from scratch. It was important to ensure that all changes in relationships that occurred between interviews were recorded. This meant that clarification of the ecomap data was needed at several intervals during the interview. However, it was also important to be careful not to interrupt the flow of the caregiver's story. Keeping your mind on gaining interview data, ecomap construction or variation and being aware of the caregiver's needs, requires focused concentration.
While I wanted participants to own their maps, I had to manage my anxiety the first time a caregiver took their ecomap and made changes to their network. This development in data collection was both exciting (because I wanted the caregiver to gain something from the process of mapping their support system), but also a bit scary (as I needed to protect the usefulness of the data).
Data from interviews contained the descriptors and details of the ecomaps. Recordings of the interviews were transcribed verbatim from audio tapes, being careful to capture the emotional content. Transcriptions were checked for accuracy by listening to each audio tape while reading the corresponding transcript and checking the ecomap detail. Descriptive analysis of the data was undertaken between interviews so that we could capture the issues at that time and check issues with other participants in the next round of interviews.
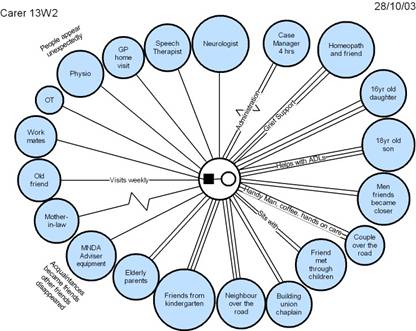
It became apparent that a few participants were adopting "ecomap phrases" and incorporating these into their story. For example one caregiver described a relationship in this manner: "She's re-establishing, I think she's making an effort to become a two line person". The first ecomaps strictly followed the design set out by Hartman (1995), but as the caregivers' stories became more detailed I found that it was valuable to expand the scope of the ecomap. I began writing information along the lines and making notes on the edges as seen in the example below. This increased the visual cues for both the participants and myself, enabling richer data to be collected.
The freehand drawings of the ecomaps now had to be translated into computer images, so that they could be correlated with the interview data through the computer software, and later incorporated into presentations and publications. However, this was not as easy as first thought. I trialled several different software packages in an attempt to create a clear representation of the ecomaps drawings. Problems arose when trying to consistently create parallel lines that were both straight and jaggered, together with reproducing the named circles. Reproducing each ecomap was very time-consuming and required careful checking. Eventually, the ecomaps were created in separate documents and cross referenced to the interview data. I printed out the ecomaps for each case and laid them out in consecutive order. It was exciting to be able to visually track the changes in relationships across each caregiver's case study. Back to Project Home Page
|